A Year In Running
| Project Infobox | |
|---|---|
| Self researcher(s) | Valera Vasylenko |
| Related tools | Runkeeper |
| Related topics | Sports and fitness, Activity tracking |
Builds on project(s) |
|
| Has inspired | Projects (0) |
| Show and Tell Talk Infobox | |
|---|---|
| Featured image | 
|
| Date | 2015/09/19 |
| Event name | 2015 QS Europe Conference |
| Slides | A-year-in-running.pdf |
| This content was automatically imported. See here how to improve it if any information is missing or out outdated. |
A Year In Running is a Show & Tell talk by Valera Vasylenko that has been imported from the Quantified Self Show & Tell library.The talk was given on 2015/09/19 and is about Sports and fitness, and Activity tracking.
Description[edit | edit source]
A description of this project as introduced by Quantified Self follows:
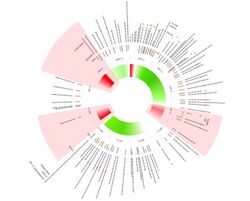
After a 2013 breakup, Valera Vasylenko wanted to get back in shape, so he started running and tracking it. He then collaborated with friends to build an interactive tool that allows one to change to the data, like restarting data and to build the realization with the data, not only for himself, but for others too. In this talk, he discusses the new data visualization techniques with his running data that help him learn more from it and see how it changed the way he shares his story.
Video and transcript[edit | edit source]
A transcript of this talk is below:
Valera Vasylenko “A Year In Running”
My name is Valera, and I am going to tell a story about one of my years in running. We all know that nobody just outrunning just to start running. It could be connected with some fitness goals, but more likely it’s a way to replace something or somebody to find some new attraction for yourself to replace something or somebody. And I think it was the same for me, it was much 2013 breakup how I call it now freedom, so I just start running to find some new attraction. A little introduction here, the long dashed lines distance, and the short one is pace, and the pass in the bottom are air temperature. So summer was really hot, and my running’s was occasional. There was like some injury and also relocating for another city. But like I have a new community and new people around, so my like late-night running, change it with late-night hangouts. But I was bored about that, and I just reduced it for a half marathon in Paris, booked the air tickets and hotel and there was no way back. So yeah, you can see the training plan was stable and I ended up successfully finished on a half marathon. But after that I came home, not home, but in North Pole that felt at the moment, like a -10°. And I’m not very good at running outside with the ice on the street, so I changed the recovery pace with the gym, but all this story allows me to put all the data on some circle. It is like the same for seasonal here, whereas the each season represents and that like allows me to see, not see only the running, but fill all the moments in my life for this year. So how I did it, I just I had an idea to build up some radial diagram, but I had an expert at data and I was trying to find some realization to, but it didn’t work for me so I just put all the dots and I have some experience in some graphic tools. I’m just put all the dots on a grid, and the results I have got me realization. But when I talk to my friends, who are developers, the only question was “Seriously!” And I collaborated with friends and we built an interactive tool. So that now allows to change the data, like restarting data and to build the realization with the data, not only from me, but also from other people. And when I look on that I realize that at some moment I realize that the gaps between the running’s, compared to some bad and poor mood in my life. So we change the inner circle with some presentation of moods. I figure out that yeah, exactly that, like a poor mood condition fits in the gaps.
So the conclusion here is run, just run. And what I’m like trying to work on is to create some interactive map that represents all the aspects of your life, for activity, sleep, rest, and HR etc. and to try to find some connections. It’s not necessary that there will be some conclusions and insights, but it’s worth trying. So thanks.
About the presenter[edit | edit source]
Valera Vasylenko gave this talk.